River Sentiment Dashboard
The River Sentiment Dashboard supports river stewards with live information about social media sentiment regarding 400 water bodies in the Thames basin. The tool answers the question how Twitter users feel about a specific water body.
Helge Peters,
Oxford University
Author
![]() @RiverSentiment ❐
@RiverSentiment ❐
Twitter
Project website
https://www.riversentiment.app/ ❐
Details
The tool answers the question how Twitter users feel about a specific water body.
For each water body, the dashboard displays the following sentiment information:
- monthly change of sentiment polarity
- frequency of basic emotions
- frequency of common phrases
This information can be accessed by searching for the name of a river or by navigating an interactive map. The sentiment information is displayed alongside ecological information about the water body, which allows comparing public sentiment with environmental quality.
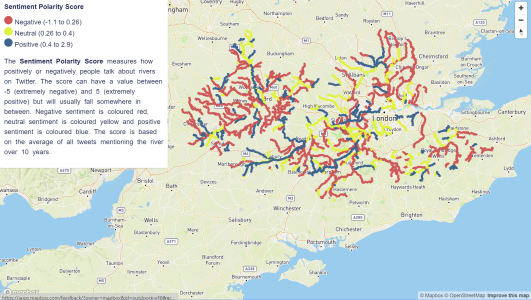
The dashboard shows how social media sentiment about a water body has shifted between positive and negative from January 1st, 2008 until the present day. A sentiment polarity score with a value between 5 for positive and -5 for negative measures how positively or negatively Twitter users have talked about the river.
The dashboard also shows which basic emotions Twitter users express when talking about the water body. These basic emotions include anger, fear, anticipation, trust, surprise, sadness, joy, and disgust. The dashboard also shows common phrases frequently occurring in tweets, which indicates salient concerns about a river.
With this information, river stewards can explore the link between human wellbeing and river water quality by comparing social media sentiment with ecological status. They can also explore the connection between the common phrases people use to describe a river with the reasons why it is not achieving good ecological status. For comparison between different rivers, a colour-coded map displays overall positive (blue), neutral (yellow), and negative (red) sentiment about all 400 water bodies in the Thames basin.
The River Sentiment Dashboard implements the NRC EmoLex Word-Emotion Association Lexicon to process a continually updated data set comprising 4+ million tweets that mention any water body from a list of designations extracted from Defra’s Catchment Data Explorer.
The River Sentiment Dashboard was developed as a working prototype by researchers from Oxford University in collaboration with Thames21. The project received funding from the UK Economic and Social Research Council.