Water Quality Dashboard
The Water Quality Dashboard presents data about river water quality and how it varies, both geographically and in time.
![]() Svea Rautenberg,
Svea Rautenberg,
BGS
Author
![]() camellia@bgs.ac.uk ❐
camellia@bgs.ac.uk ❐
Email
Project website
https://bgs.maps.arcgis.com/apps/MapSeries/index.html?appid=57cb1b40a0424b109d474c27dfddba41 ❐
Details
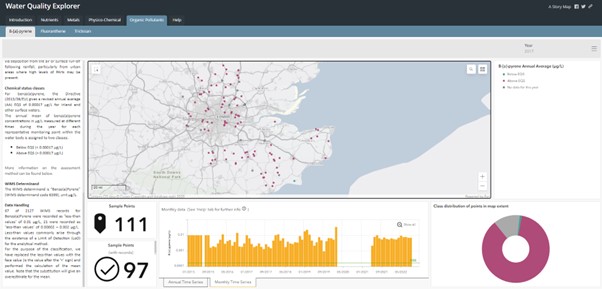
The Water Quality Dashboard presents data about river water quality and how it varies, both geographically and in time.
Monitoring information from the Environment Agency’s Water Quality Data Archive has been analysed and the various water quality indicators are displayed in accordance with their surface water classification on interactive maps within the dashboard, which can be filtered by year. Graphics are showing the seasonal distribution of nutrients, metals, physico-chemical parameters, and pollutants in the river network across Greater London, Hertfordshire and Kent.
Metadata
Water Quality Explorer metadata ❐